US CPI Review: March 2024 — not as bad as it seems
While rate cut expectations shifted drastically on the back of another hot CPI report, a look at the underlying detail suggests that it may be an overreaction.
Headline and core CPI growth comes in above expectations for the fourth consecutive month
For the fourth consecutive month, both headline and core CPI inflation exceeded consensus expectations.
Headline CPI growth came in at 3.5% YoY, up from 3.2% in February.
Core CPI growth came in at 3.8% YoY, unchanged from February.
Monthly, 3- and 6-month annualised trends all remain well above 2%
While down slightly on February’s MoM growth of 0.44%, headline CPI growth was a still strong 0.38% MoM, or 4.6% annualised.
This took 3-month annualised growth to 4.6%, while 6-month annualised growth remained at 3.2%. The 3-month annualised growth rate is now 2.4x higher than the trough of 1.9% recorded in December.
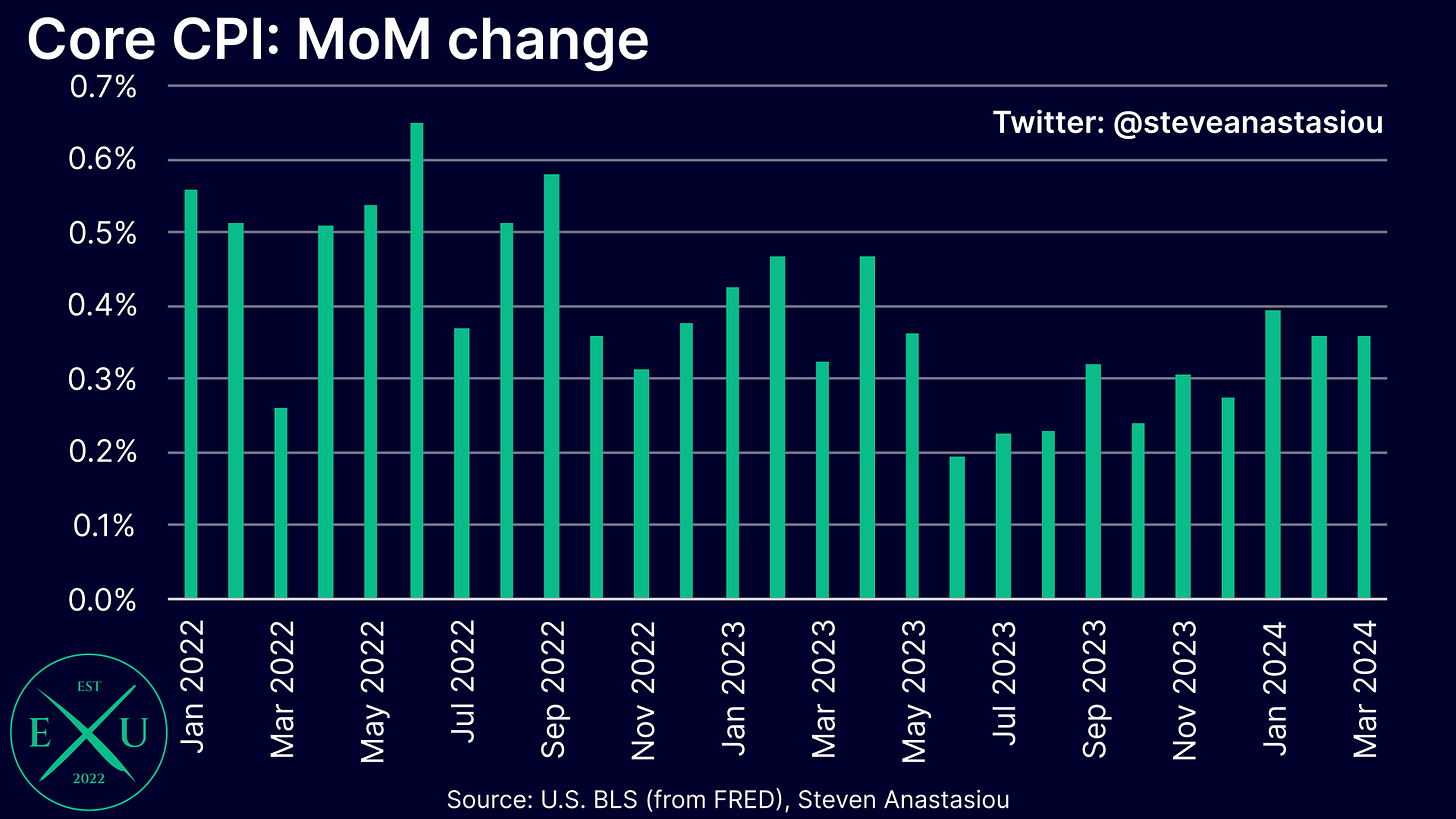
For the second consecutive month, core CPI growth came in at 0.36% MoM, or 4.4% annualised.
This took 3-month annualised growth to 4.5% (up from 4.2%), while 6-month annualised growth remained at 3.9%.
Annual CPI ex-shelter growth also rises in March
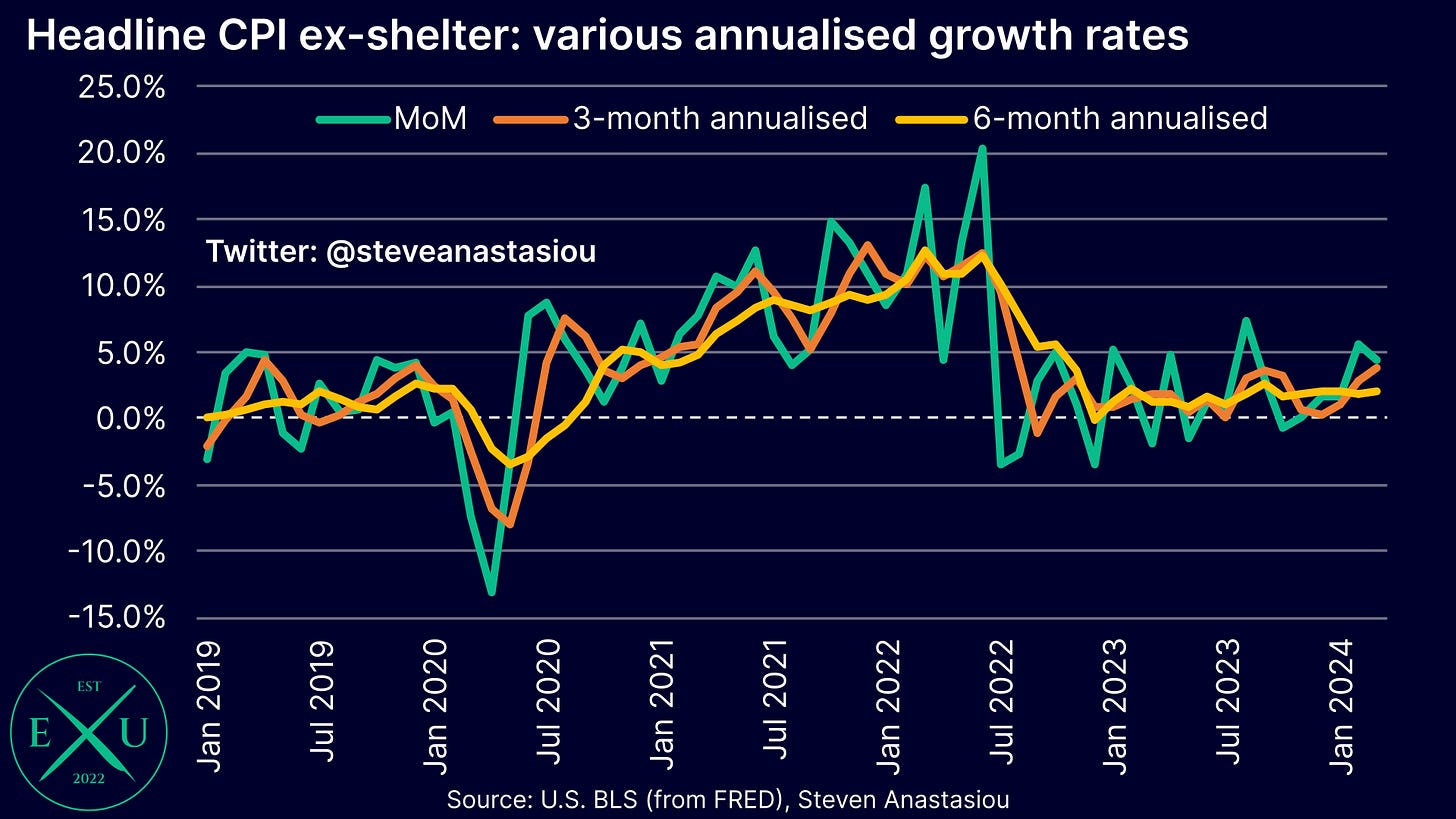
On an ex-shelter basis, headline CPI growth rose to 2.3% YoY, up from 1.8% in February, to its highest level since April 2023.
Core CPI ex-shelter growth rose to 2.4% YoY, up from 2.2% in February, to its highest level since July.
Monthly ex-shelter growth remains elevated in March
While down from the MoM growth of 0.45% recorded in February, headline CPI ex-shelter growth came in at 0.36% MoM, or 4.4% annualised in March.
This resulted in 3-month annualised growth rising to 3.8%, its highest level since August 2022, while 6-month annualised growth rose to 2.1%.
Core CPI ex-shelter growth remained elevated at 0.31% MoM or 3.8% annualised, slightly higher than the 0.30% recorded in February.
This resulted in 3-month annualised growth rising to 3.3%, its highest level since May and 6-month annualised growth rising to 2.7%, its highest level since June.
Market reaction follows the potential move highlighted in my US CPI Preview
While I had anticipated a shift to softer CPI growth in March and noted that I had viewed this as the more pertinent risk, given the volatility in inflation data, I nevertheless outlined the potential impact on markets of another hotter than expected CPI report in my US CPI Preview (emphasis added on key points):
In the event that CPI growth instead comes in well above consensus expectations, then concerns about the outlook for interest rate cuts are likely to increase significantly. This could see markets firmly price out a June interest rate cut and move towards an expectation for just one or two interest rate cuts in 2024. This could see the 10-year yield rise to 4.5% or above, and in light of rising net coupon issuance, could lead to another bout of concerns surrounding the longer-term outlook for interest rates and the term premium”
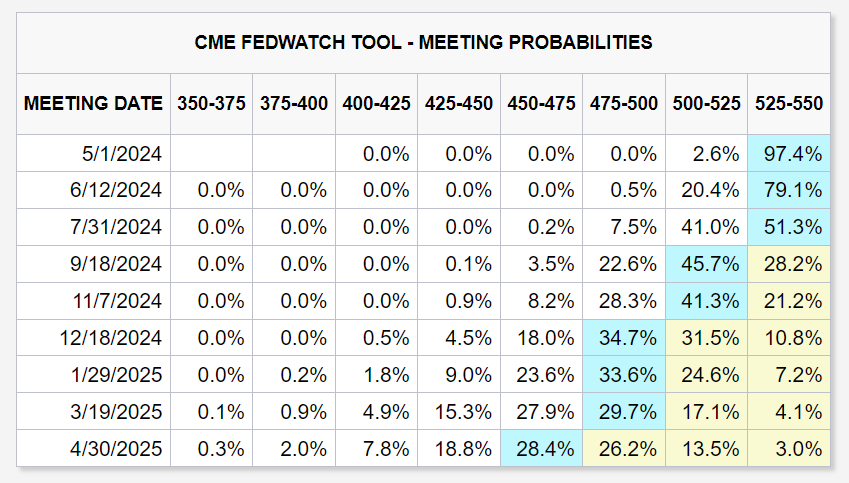
Since the release of the US CPI report, the US 10-year Treasury yield has risen well above 4.5%, a June interest rate cut has been firmly priced out — at the time of writing, the CME FedWatch Tool is recording just a 20.9% chance of an interest rate cut by June, versus 54.0% at the time of writing my US CPI Preview — and just two interest rate cuts are now expected in 2024.
The key question that remains outstanding, is whether this shift leads to a more significant increase in the term-premium, as investors potentially fret about the prospect of higher for longer interest rates in an environment of large government deficits, increasing net coupon issuance, and a significantly drained RRP facility.
While another hot CPI report may indeed spark significant concerns and a more material move higher in longer-term bond yields, as discussed below, I believe that the market may be overreacting to the latest CPI report, which is not as bad as it seems at first glance.
Note that any market related commentary is general in nature and does not constitute personal investment advice to any person.
Looking below the surface shows that the latest CPI report wasn’t as bad as it seemed — elevated MoM growth was primarily driven by abnormally large spikes in just 3 items
Despite another month of significantly elevated MoM growth across both the headline and core CPI, a deeper look reveals that the underlying story is not as bad as a simple glance at the headlines may suggest.
In order to understand why, the first point to note, is that durable goods prices actually declined by more than I had expected, with non-seasonally adjusted MoM growth coming in at -0.19% MoM, versus my forecast of -0.12% MoM. This resulted in YoY growth falling to -2.1% in March, from -1.6% in February. As discussed in the “Breaking down the details” section below, the trends within the different durables components also points to more significant YoY declines over the months ahead.
The second point to note, is that nondurable goods prices also broadly saw smaller than expected increases — lower than expected MoM growth was seen across food, energy commodities and the other goods categories, while the medical commodities component recorded below average MoM growth for a fourth consecutive month. As a result, overall nondurables price growth remained muted at 1.7% YoY, despite another jump in gasoline prices in March.
The M2 money supply, plus the two more leading components of the CPI equation (being durables and nondurables prices), thus continue to suggest that there’s little reason to be concerned about a second wave of high inflation.
With durables and nondurables price growth largely coming in better than I had expected, this means that the surprise versus my forecasts was driven by services prices. But even here, the picture is not as bad as it seems at first glance.
Firstly, owners’ equivalent rent (OER) and rent of primary residence (RPR) both saw MoM growth that was below my expectations, reaffirming my expectation (which is based on leading BLS data), that both OER and RPR will see a significant further moderation in MoM growth during 2024.
Secondly, both the education and communication services, and public transportation components saw MoM growth that was largely in-line with my forecast, with YoY growth continuing to remain unconcerning/below average.
Thirdly, the MoM change in CPI recreation services prices came in below the historical average and below my forecast.
Given all of this, how did the services category drive such a significant forecast miss?
It largely came down to just three items: hospital and related services; motor vehicle maintenance and repairs; and motor vehicle insurance.
Each of these items saw a MoM surge in March, which was significantly out of sync with the broader trend seen over the past 6 months. Given the broader trend, such large MoM changes would not be expected to be consistently repeated — and particularly not all within the same month.
Given the large abnormal nature of MoM growth within these three items, it’s no surprise that CPI growth came in above both my estimates and consensus expectations. Indeed, these three items alone accounted for 15.8 basis points of the core CPI’s MoM growth of 52.9 basis points (non-seasonally adjusted). This compares to my forecast for these three items to contribute 5.8 basis points of MoM growth to my overall core CPI forecast of 39.0 basis points. As a result, these three items alone accounted for 10 basis points of my 13.9 basis point forecast miss on MoM core CPI inflation (non-seasonally adjusted).
Breaking down the details
After providing an overarching summary of the key points that stemmed from the latest CPI report, let’s now break down the key components in greater detail — including new and used cars, food, OER, RPR and a broad range of other services categories (including those mentioned above).
With 1,600+ words of additional in-depth analysis and 28 additional charts included in the section below, the inflation reports that come with a premium subscription to Economics Uncovered are some of the most comprehensive and insightful that you will find.


